TOFFS provides both Real User Monitoring and Synthetic Monitoring for your website. With over 140 PoPs in various cities in China and Asia Pacific, we monitor the experience of a enduser connecting to your website and is able to provide the data breakdown from DNS to first byte to load and the whole pageload performance of end users in various cities
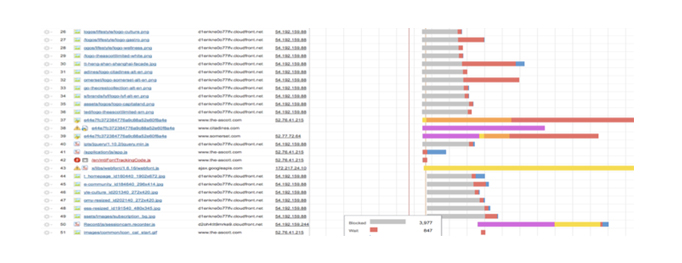
Waterfall charts are diagrams that let you visualize data that is generated cumulatively and sequentially across a process. In the case of performance waterfalls, they let you see the series of actions that occur between a enduser and your server in order for that user to view a specific page of your site.
Toffs provide monitoring PoPs to actually simulate user behavior and judge performance accordingly
Real User Monitoring (RUM) and Synthetic Monitoring
Real User Monitoring measures performance through the actual users visiting and interacting with the web application. This is a passive approach in which the actual users provides the data to TOFFS Platform. Real User Monitoring is generally performed by embedding Java scripts within the web pages (web page code), which then collect all relevant performance data and send along for analysis.